Nejnovější:
- Sailfish OS and memory
- Hillshade tile server
- Statistics of OSM Scout for Sailfish OS
- Nebezpečný router
- Tree model with Silica components
Podle data:
- listopad 2021
- leden 2019
- prosinec 2017
- prosinec 2016
- květen 2014
- duben 2014
- listopad 2013
- duben 2013
- duben 2011
- únor 2011
- leden 2011
- srpen 2010
- květen 2010
- březen 2010
- leden 2010
- říjen 2009
- duben 2009
- únor 2009
- říjen 2008
- září 2008
- srpen 2008
- duben 2008
- březen 2008
- únor 2008
Téma:
Sailfish OS and memory
Battery in my lovely Jolla C starts dying slowly, so I bought Sony Xperia 10 II and flash Sailfish OS on it, as soon as it was possible to buy license for this phone. Xperia 10 II is the best and newest officially supported phone by Jolla. Support of this hardware was pretty buggy at the time of the launch at May 2021. I'm suffering by suboptimal memory configuration especially. Xperia 10 II has 4 GiB of RAM (it is twice as Jolla C, four times as Jolla 1), but system behaves as it is under constant memory pressure, when multiple memory demanding applications are opened. Like web browser and my OSM Scout (maps). System is aggressively terminating applications running on the background to keep some memory reserve. It is frustrating when victim is music player and you have to start it manually again. It is much better after system release 4.2 at September 2021, but it is not optimal yet.
For that reason, I start experimenting a bit. But before going to results, short overview how various systems treat with memory.
Linux desktop
Desktop Linux distributions are not using some special tricks for managing memory usually. When applications eats all available memory, UI becomes less responsive as kernel is desperately trying to find a place for the new allocations. When memory pressure continue, kernel starts OOM killer (out-of-memory killer) and it kills most demanding process.
Mobile phones has less resources than desktop computers and users are very sensitive for UI freezes. For that reason, mobile systems are trying to maintain some free memory reserve to guarantee instant memory allocations.
Android < 9
Android introduced low-memory killer. It lives in kernel and kills least essential process when free (and reclaimable) memory goes down under configured limit.
Android >= 9
In-kernel low memory killer has multiple downsides as described on source.android.com. For example, it doesn't help when memory pressure is caused by extensive page cache usage. For that reason, newer Android contains user-space low memory killer daemon – lmkd. It monitors memory pressure via cgroup kernel api and limit memory resources (via cgroup) for less important processes.
Sailfish OS
Sailfish OS still uses kernel-space low-memory killer in its recent release (4.3). But as this system has support for running Android applications via its Android AppSupport layer (formerly known as Alien Dalvik), there is user-space lmkd too. Because AppSupport provides compatibility with Android 10. Luckily, AppSupport is running in its own isolated cgroup, so lmkd is not killing native applications.
So, lets focus on kernel low-memory killer. It is relative simple module, its
sources may be found on android.googlesource.com.
It is hooked as memory shrinker. When system needs to release some memory, it
iterates over processes and when some unfortunate has higher
oom_score_adj value than limit for currently available memory, it
is killed. No mercy. Limits may be tuned of course.
The lowmemorykiller driver lets user-space specify a set of memory thresholds
where processes with a range of oom_score_adj values will get killed. Specify
the minimum oom_score_adj values in
/sys/module/lowmemorykiller/parameters/adj and the number of free pages in
/sys/module/lowmemorykiller/parameters/minfree. Both files take a comma
separated list of numbers in ascending order.

For example, write "0,8" to /sys/module/lowmemorykiller/parameters/adj and
"1024,4096" to /sys/module/lowmemorykiller/parameters/minfree to kill
processes with a oom_score_adj value of 8 or higher when the free memory
drops below 4096 pages and kill processes with a oom_score_adj value of 0 or
higher when the free memory drops below 1024 pages.

The driver considers memory used for caches to be free, but if a large
percentage of the cached memory is locked this can be very inaccurate
and processes may not get killed until the normal oom killer is triggered.
oom_score_adj value for Sailfish applications is setup by
compositor / main screen process Lipstick, it has good
knowledge what application is running on the foreground and what was not used
for a while. This component is close-source unfortunately, so we cannot inspect
exact logic, but it seems that it setup oom_score_adj value from 0
(foreground application) to 100 (background application, not used for a
while).
From system point of view, it is good to keep some free memory reserve to guarantee low latency for new allocations. In other hand, from application point of view, it is good to preload content that will be needed and keep recently used objects in memory as a cache. One example is web browser, user will appreciate that browser tabs are not re-loaded on every switch. Second example is map application, cached data in memory speed up map rendering. It would be waste of resources, when every application would need to monitor system memory to keep its caches in bounds. For that reason, there is another important daemon in Sailfish OS: mce. It monitors system memory via cgroups api (with older kernels it may use memnotify api) and expose memory pressure level via D-Bus api. Mce memory pressure may have one of three values: normal, warning or critical. Api is described on wiki.
On warning level non-essential resources should be released, and on critical
level oom killing of some processes can be expected.
Sailfish OS 4.3 on Xperia 10 II
This phone has 4 GiB of RAM memory. But as MemTotal row in
/proc/meminfo shows, just 3.5 GiB is available for the system.
Remaining 512 MiB is used by the graphic card probably. Beside that memory,
there is 1 GiB of zram swap with lz4 compression. It usually has compression
ratio 70%, so it virtually adds ~700 MiB of memory. But swap is not counted to
available memory. Yeah, it is complicated :-) Low-memory killer configuration
is: adj:0,58,147,529,1000,
minfree:92160,115200,138240,161280,206490 (values are in
pages).
| oom_score_adj | min free (MiB) |
|---|---|
| 0 | 360 |
| 58 | 450 |
| 147 | 540 |
| 529 | 630 |
| 1 000 | 807 |
For executing my experiments, I prepared Sailfish build of memory-watcher – set of tools that I was created few years ago for memory analysis of embedded devices. It allows sampling memory usage of all processes and store samples to sqlite database for further analysis. Via ssh (as root), I started:
- memory sampling every 5 seconds:
memory-record --period 5000 - storing kernel log:
journalctl -fe | grep kernel > kernel.log - storing mce log:
journalctl -fe -u mce > mce.log
Then I started my favorite applications, like Mail, Browser, Piepmatz… and then OSM Scout that utilizes pretty huge amount of memory when renders maps. Low-memory killer killed every application on background after some time.
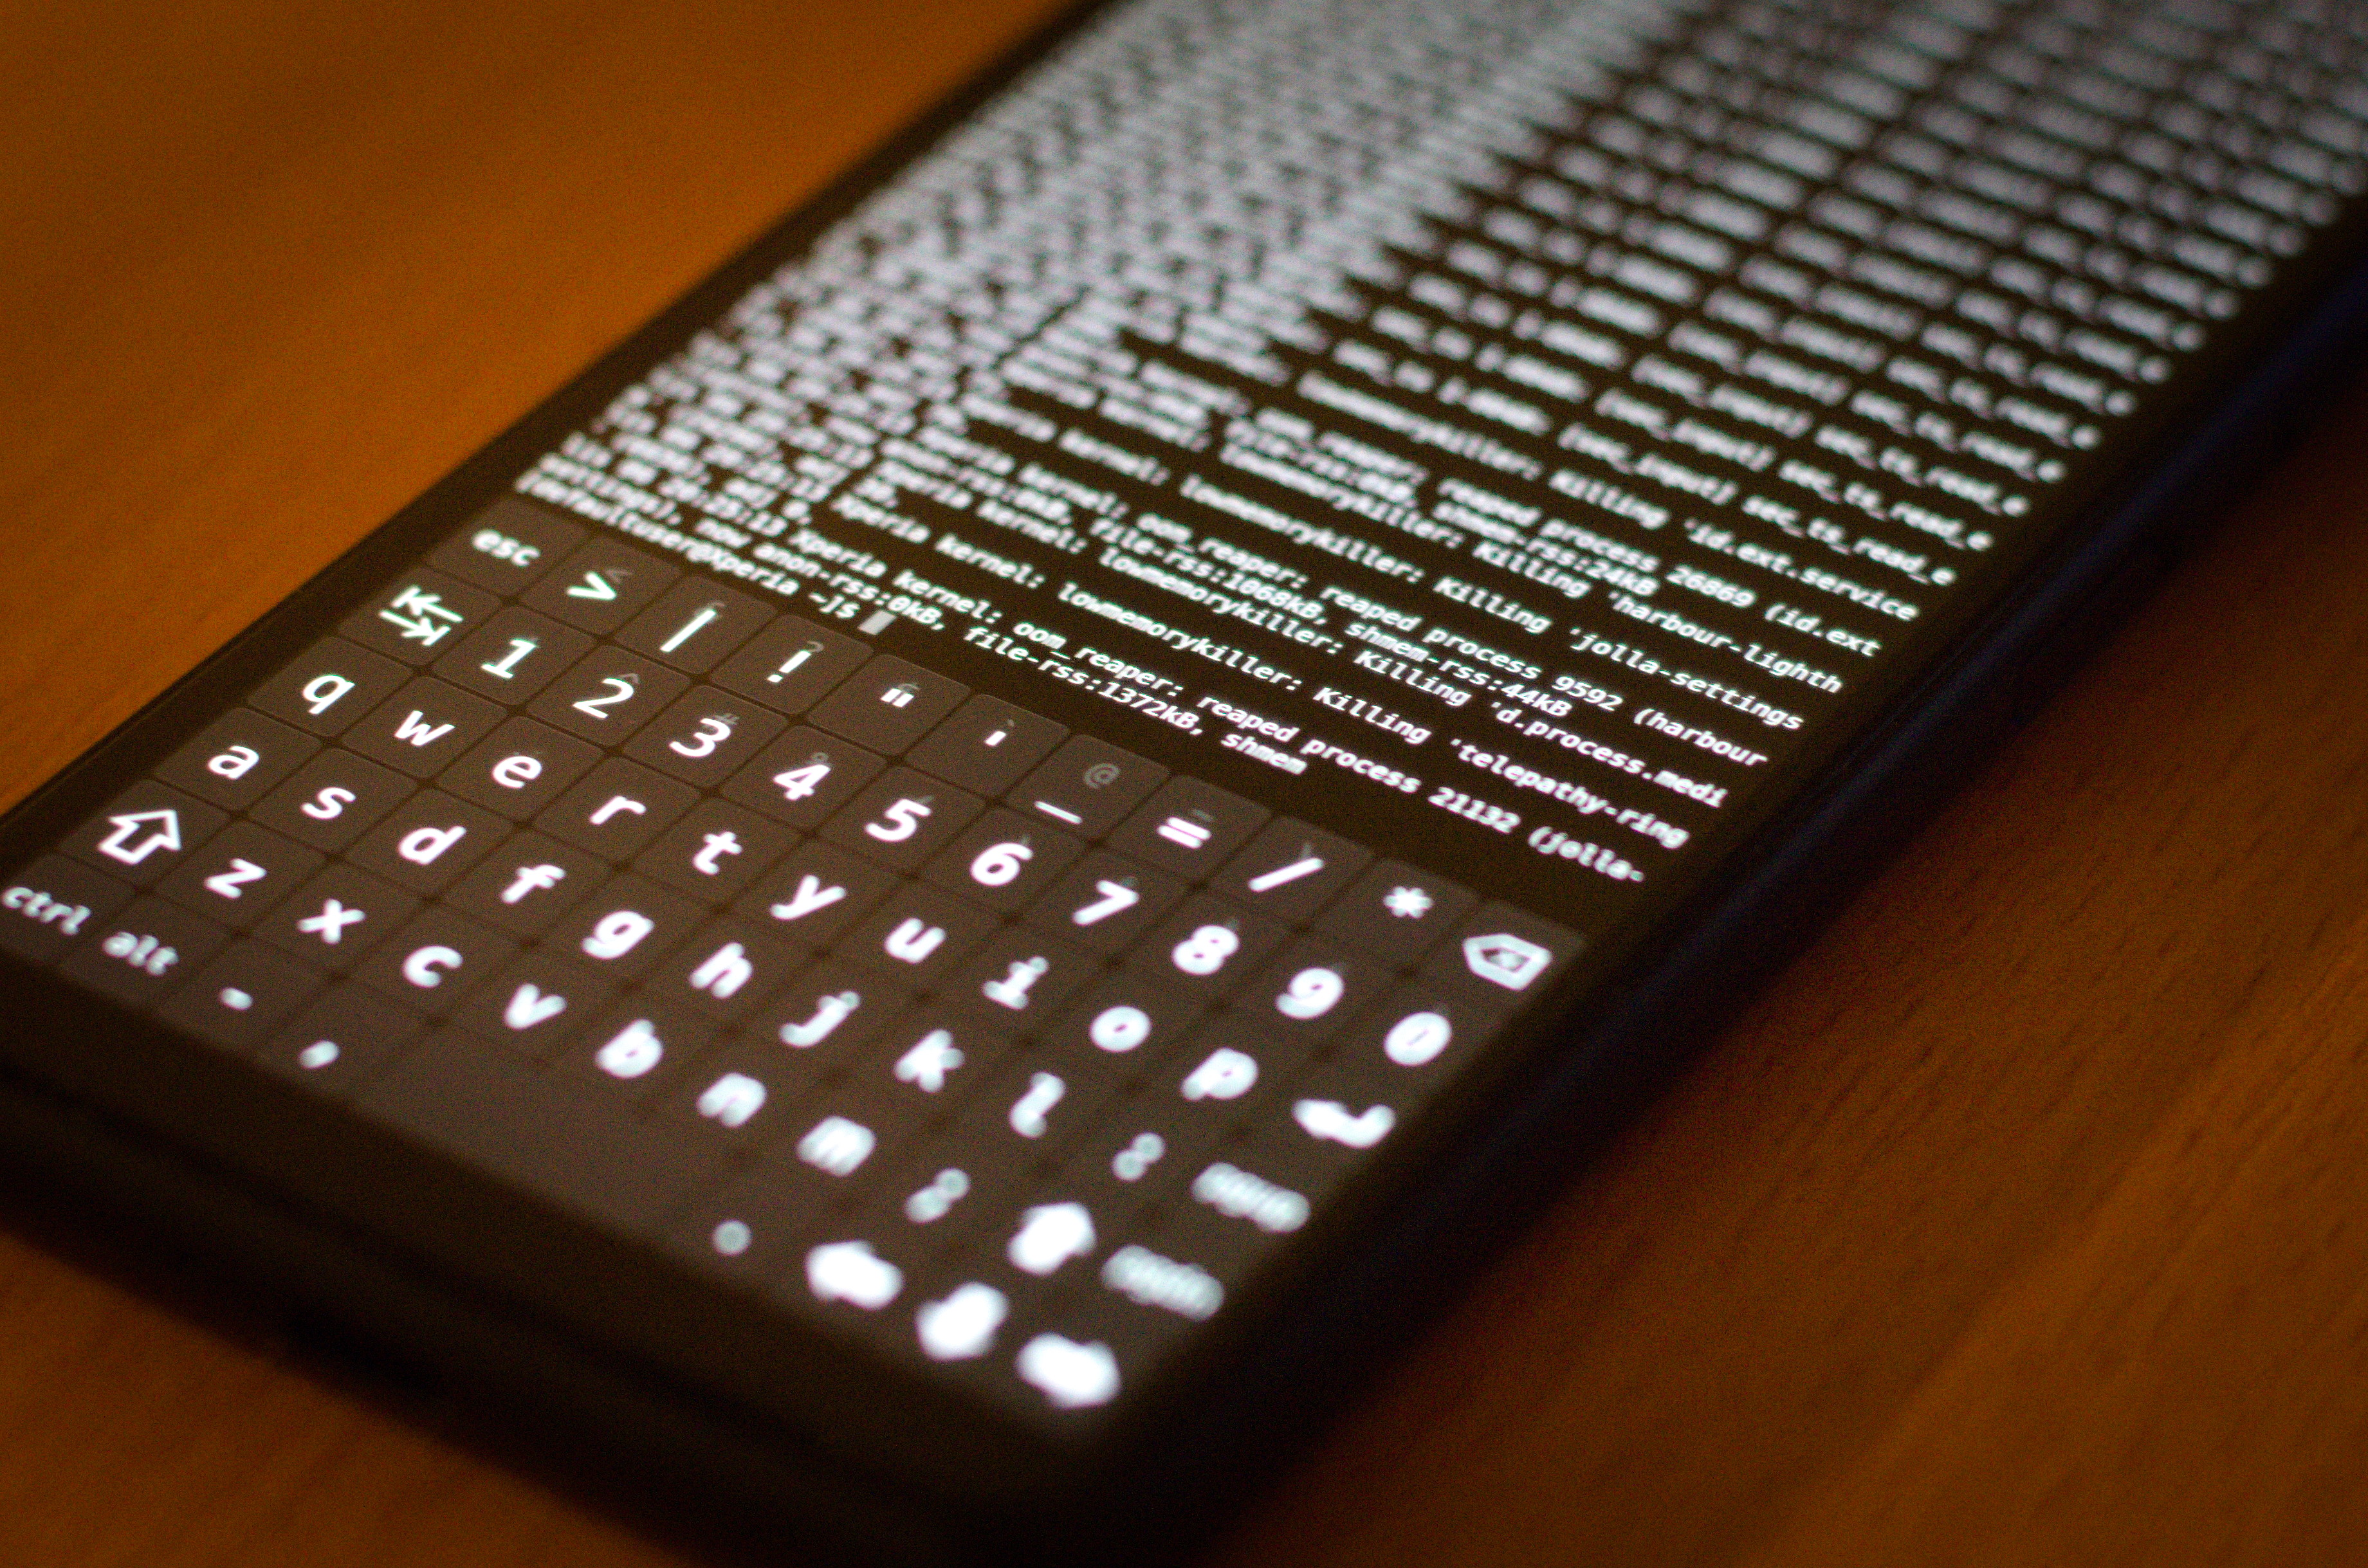
$ cat kernel.log | grep lowmemory
lis 06 20:15:17 Xperia kernel: lowmemorykiller: Killing 'jolla-email' (9522), adj 75,
lis 06 20:15:17 Xperia kernel: lowmemorykiller: Killing 'sailfish-browse' (9530), adj 74,
lis 06 20:15:17 Xperia kernel: lowmemorykiller: Killing 'harbour-piepmat' (21252), adj 73,
lis 06 20:15:17 Xperia kernel: lowmemorykiller: Killing 'harbour-sailfis' (10974), adj 72,
lis 06 20:24:39 Xperia kernel: lowmemorykiller: Killing 'id.ext.services' (24811), adj 100,
lis 06 20:24:58 Xperia kernel: lowmemorykiller: Killing 'id.ext.services' (26765), adj 100,
lis 06 20:25:13 Xperia kernel: lowmemorykiller: Killing 'id.ext.services' (26869), adj 100,
lis 06 20:25:13 Xperia kernel: lowmemorykiller: Killing 'harbour-lightho' (9592), adj 71,
lis 06 20:25:13 Xperia kernel: lowmemorykiller: Killing 'jolla-settings' (21132), adj 70,
lis 06 20:25:13 Xperia kernel: lowmemorykiller: Killing 'd.process.media' (24290), adj 30,
lis 06 20:25:13 Xperia kernel: lowmemorykiller: Killing 'telepathy-ring' (6656), adj 0,
How system memory looked few seconds before 20:15:17 ?
$ memory-peak --measurement-time "2021-11-06T20:15:16"

Memory at 2021-11-06T20:15:12.257
Memory details: 3.5 GiB total, 53.7 MiB free, 48.4 MiB buffers, 457.9 MiB cached (including 10.2 MiB shmem (tmpfs)), 0 B swap cache
Kernel:         322.7 MiB SLAB (105.2 MiB reclaimable),
                ~ 1.3 GiB other kernel memory? It means: total - anonymous process - slab - free - buffers - cached - swap cache
Swap:           1024.0 MiB total, 348.5 MiB free (34%)
Available:      528.6 MiB (15%) estimated by kernel
                655.0 MiB (18%) computed. It means: free + buffers + (cached - Shmem) + swap cache + slab reclaimable

Processes memory (smaps Pss):

    PID process                                                 size (% of total)  [oom_adj, oom_score, oom_score_adj]
  24364 harbour-osmscou                                    579.4 MiB (16%)
   9530 sailfish-browse                                    202.7 MiB (6%)  [74, 0, 0]
   5612 lipstick                                           117.2 MiB (3%)  [-750, 0, 0]
  21252 booster [silica                                    109.4 MiB (3%)  [73, 0, 0]
   9522 booster [browse                                     78.9 MiB (2%)  [75, 0, 0]
   6262 system_server                                       58.6 MiB (2%)  [-900, 0, 0]
  21132 jolla-settings                                      37.7 MiB (1%)  [70, 0, 0]
  23516 memory-record                                       31.9 MiB (1%)  [-1000, 0, 0]
   6601 voicecall-ui                                        29.1 MiB (1%)  [-250, 0, 0]
  18185 geoclue-mlsdb                                       26.8 MiB (1%)
  24290 d.process.media                                     26.4 MiB (1%)  [30, 0, 0]
  10974 harbour-sailfis                                     23.2 MiB (1%)  [72, 0, 0]
  24455 id.ext.services                                     18.8 MiB (1%)  [100, 0, 0]
   6295 maliit-server                                       17.5 MiB (0%)
   9592 harbour-lightho                                     16.9 MiB (0%)  [71, 0, 0]
  24203 booster [silica                                     16.5 MiB (0%)  [-1000, 0, 0]
  24126 booster-browser                                     14.8 MiB (0%)  [-1000, 0, 0]
   6270 harbour-ownclou                                     14.1 MiB (0%)  [-750, 0, 0]
   7291 ndroid.systemui                                     13.3 MiB (0%)  [-800, 0, 0]
   5455 messageserver5                                      11.3 MiB (0%)  [-250, 0, 0]
   2083 contactsd                                           11.2 MiB (0%)  [-250, 0, 0]
   7377 m.android.phone                                     11.0 MiB (0%)  [-800, 0, 0]
   6734 apkd-bridge-use                                     10.3 MiB (0%)  [-250, 0, 0]
   5085 connmand                                             9.3 MiB (0%)  [-1000, 0, 0]
   9806 booster [browse                                      9.3 MiB (0%)  [-1000, 0, 0]
   6715 tracker-miner-f                                      8.7 MiB (0%)  [-750, 0, 0]
  11240 geoclue-hybris                                       8.3 MiB (0%)  [-750, 0, 0]
    641 systemd-journal                                      7.3 MiB (0%)  [-1000, 0, 0]
   5829 commhistoryd                                         6.5 MiB (0%)  [-250, 0, 0]
   6729 apkd-bridge                                          6.0 MiB (0%)  [-250, 0, 0]

        others                                             152.8 MiB (4%)
        sum                                                  1.6 GiB (47%)
Looking to mce.log, memory state was „normal“ during time of
the experiment! Well, I would expect that level will be „critical“ before
first app is killed.
Looking to related mce configuration:
[root@Xperia 3]# cat /etc/mce/60-memnotify-seine.conf
/system/osso/dsm/memnotify/warning/used=1032000
/system/osso/dsm/memnotify/critical/used=1079000
These values should be in pages, so it is 3.9 GiB for warning and 4.1 GiB
for critical. These values are compared with cgroup usage_in_bytes
value, read from /sys/fs/cgroup/memory/memory.usage_in_bytes (value
in bytes). From information that I found on internet, this cgroup value should
be anonymous memory of user-space processes + cache. It is absolutely different
metric than it is used by low-memory killer! It doesn't count kernel memory,
that may be ~50% of total size, anonymous memory may be in swap partially
(I believe) and it counts cache that may be reclaimed…
Uff. With current code, memory pressure provided by mce is unusable. I was not able to setup usable values even experimentally. I believe that reclaimable cache cannot be taken into account at least. Ideally, low-memory killer logic should be moved to user-space, alike as Android did. With user-space daemon, it will allow to use the same metrics for reporting memory pressure and looking for kill victim.